Beginner’s Guide to Investing
Brew a large coffee and settle in. This is the companion you can bookmark, revisit, and share with anyone who wants to move from saving to investing with confidence.
Why an Investment Mind‑Set Beats a Savings Mind‑Set
If you park every pay‑cheque in a current account you are guaranteed to lose purchasing power over time because prices rise while bank interest barely budges. In the United States, consumer prices have climbed at an average 2.9 % per year since 1990 [1]. Putting money to work in productive assets counters that erosion and, more importantly, lets you harness compound growth — a mathematical snowball Albert Einstein allegedly called the eighth wonder of the world.
Imagine two friends each deposit $5 000 a year. One earns a long‑run stock‑market‑style return of 7 % after inflation; the other keeps up with inflation but nothing more. After 40 years the investor finishes with $1.07 million, the saver with $200 000 — an 800 % gap produced by compounding rather than higher contributions [2].
The Engines of Wealth Creation
Compound Growth
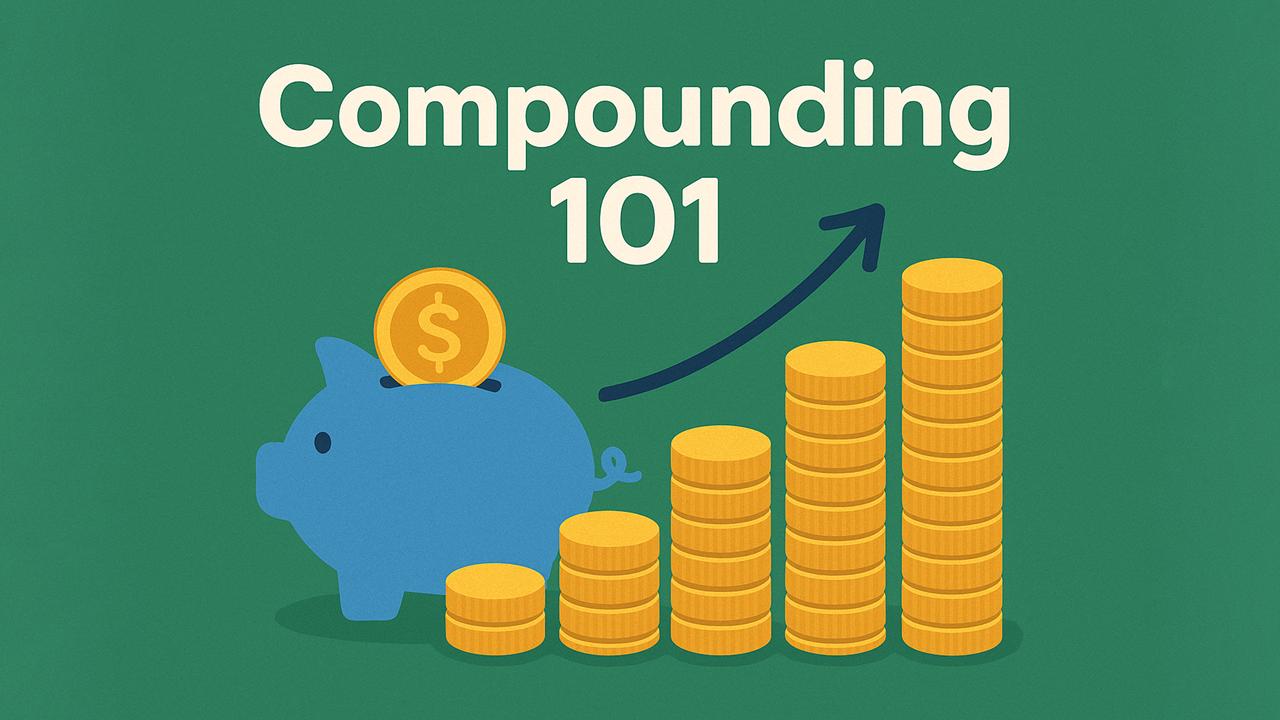
Compounding turns time into an accelerant. Each gain is added to principal, so the next gain is earned on a larger base. The simple‑yet‑relentless formula FV = PV × (1 + r)ⁿ means growth rises exponentially, not linearly. At a 7 % return, dollars double roughly every decade (Rule of 72) [2]. Start ten years late and you surrender an entire doubling cycle—an irreversible cost.
Small shifts in rate or frictions create huge long‑run gaps. Reinvest all income and shield gains from tax and fees and 8 % for 40 years turns $1 000 into about $21 700; drop to 6 % and the same money finishes near $10 300—less than half [2]. Frequency of compounding, disciplined reinvestment, and minimising drag are therefore the silent levers of extraordinary outcomes.
Inflation Drag
Purchasing power erodes whether or not markets move. Even the “modest” 2.6 % average CPI since 1990 has lifted a $1 000 basket of goods to roughly $2 250, cutting real value by more than 50 % within a single career [1]. Because inflation compounds too, idle cash beyond an emergency buffer effectively guarantees a loss: each year’s 3 % bite removes nearly one‑third of real wealth in just twelve years, and two‑thirds in twenty‑five. Beating this stealth tax requires assets that grow faster than prices—equities, inflation‑linked bonds, or productive real assets—plus periodic portfolio reviews to keep nominal returns translating into real gains.
Risk and Volatility
Volatility is the toll for access to equity‑level returns. Since 1928 the S&P 500 has suffered a calendar‑year drawdown of at least 10 % on 38 occasions, yet still posted a positive after‑inflation result in roughly 75 % of all years [3]. Intra‑year drops average about 14 %, making temporary pain look routine rather than exceptional; the key is recognising that headline declines and long‑term wealth destruction are not the same thing.
Risk, however, is not mere price fluctuation but the chance of permanent capital loss or unmet goals. Diversification, appropriate time horizons, and regular rebalancing narrow that gap. Historically the index has shown a negative real result in about one‑quarter of rolling 10‑year periods, but almost none over 20 years, converting time into the investor’s strongest shock absorber [3]. Volatility can be endured; unmitigated risk must be managed.
Mapping the Investment Landscape
Below you will find an expanded tour of the core and satellite asset classes, each discussed in prose first and rounded off with a comparative table.
Equities (Stocks)
A share represents literal ownership of a firm’s future profits. Over the last century, broad US equities produced 9‑10 % average nominal returns and about 7 % real returns [4]. That leadership stems from reinvested profits and productivity gains, offset by gut‑wrenching crashes such as 1929 (‑86 %) and 2008 (‑37 %) [5]. Liquidity is excellent: hundreds of millions of shares trade daily on major exchanges.
Key use‑case: Long‑term growth for investors who can stomach 30 % paper losses without panic‑selling.
Bonds (Fixed Income)
Bonds flip the script: you lend rather than own. Governments and blue‑chip companies repay predictable coupons that cushion equity storms. From 1926‑2023, US intermediate government bonds returned ≈ 5 % nominal and 2 % real with a fraction of stock volatility [4].
Key use‑case: Stability, income, and a psychological anchor when equities tumble.
Mutual Funds & ETFs
Funds pool thousands of securities so you can buy diversification in a single click. Passive index funds routinely outclass active managers; in 2023 87 % of large‑cap US funds trailed the S&P 500 over 10 years [6]. ETFs trade intraday like stocks, whereas open‑ended mutual funds price once at the close. Costs under 0.10 % are common for market‑wide index ETFs.
Key use‑case: Low‑effort, low‑cost building blocks for nearly any allocation.
Real Estate
Property offers income plus a roof you can literally touch. Direct ownership, however, demands capital, debt, maintenance, and tenant headaches. Real‑Estate Investment Trusts (REITs) solve liquidity and diversification by packaging hundreds of buildings into a tradable share. REITs paid an average dividend yield of 3.8 % in the US over the past decade [7].
Key use‑case: Inflation hedge and income diversification — without a 3 a.m. broken‑boiler call.
Gold & Broad Commodities
Gold shines when faith in paper assets falters, which explains its role as a crisis hedge. Real returns hover near inflation (≈ 1 % real since 1900) but spike during recessions and wars [8]. Broader commodity baskets cover oil, grains, and metals that track economic cycles.
Key use‑case: Portfolio insurance and an inflation shock absorber.
Cryptocurrency
Bitcoin has returned ≈ 50 % annualised 2014‑2023 but crashed over 70 % on five occasions [9]. Digital assets trade 24/7, lack mature regulation, and remain highly speculative. Limiting exposure to a single‑digit portion caps downside while preserving asymmetric upside.
Key use‑case: High‑risk satellite for tech‑savvy investors willing to lose their stake.
Comparative Snapshot
| Asset Class | Long-Run Return* | Typical Annual Volatility | Liquidity | Core Role |
| Global Stocks | 8-10 % | High (15-20 % σ) | Seconds | Primary growth |
| Investment-Grade Bonds | 3-5 % | Low-Mod (4-8 %) | Same-day | Stability & income |
| Global REITs | 6-8 % | Moderate | Minutes | Real-asset inflation hedge |
| Gold | 4-5 % | Moderate | Minutes | Crisis diversifier |
| Crypto (BTC) | 25 %+ | Extreme | Seconds | Speculative growth |
| Savings Cash | ≤ 1 % | None | Immediate | Emergency / liquidity |
*Nominal annual averages, 1928‑2023 or best available estimate.
Foundational Principles That Keep Portfolios Alive
Diversification
Holding assets that do not move in lock‑step dampens portfolio volatility more than it depresses expected return — Harry Markowitz’s “free lunch.” A single business can be crippled by litigation, fraud, or technological obsolescence; a 5 000‑stock global ETF is insulated from any one firm, sector, or country implosion [10]. Because correlations across equities, bonds, real assets and alternatives are materially below 1, mixing them shrinks the range of outcomes for a given target return.
Diversification also smooths the investor’s behaviour. When one sleeve inevitably lags, another usually leads, reducing the pain that tempts capitulation. The goal is not to own “everything,” but to own enough non‑overlapping drivers of return — growth, value, credit, duration, inflation protection — that no single shock can derail the plan [10].
Risk Capacity vs. Risk Tolerance
Capacity is the arithmetic of time and cash‑flow needs; tolerance is the psychology of sleepless nights. A 25‑year‑old saving for retirement can mathematically shoulder a deeper interim loss than a retiree drawing income, yet both may abandon a sensible strategy if the emotional stress of a 30 % drawdown feels intolerable. Align the two or the portfolio will be surrendered at the worst possible moment.
Asset Allocation
Academic work attributes more than 90 % of the dispersion in long‑term portfolio returns to the chosen blend of asset classes, not individual security selection [11]. Strategic allocation therefore sets the ceiling and floor for outcomes: equities for growth, bonds for stability and spending needs, real assets for inflation defence, and cash for optionality.
Start with the investor’s liabilities — future college tuition, a mortgage payoff, retirement withdrawals — and back‑solve for the mix that can fund them with a tolerable failure probability. Tactically tilting around the edges can add value, but only if it does not corrupt the strategic core.
Periodic reviews are essential as human capital, spending horizon, and market valuations shift. The mix you need at 30 will not match the mix you need at 60; failing to adapt risks either unmet goals or unnecessary caution [11].
Rebalancing
Markets drift, silently rewriting the risk script. Resetting allocations annually or when any sleeve strays 5‑10 % restores the intended profile and forces “buy low, sell high” without heroics. The discipline harvests excess return from mean‑reverting assets while preventing a runaway winner — or loser — from dominating the portfolio.
Dollar‑Cost Averaging
Fixing a contribution amount and schedule converts volatility into a discount mechanism. When prices fall, the same dollar buys more shares; when they rise, fewer. Over every rolling decade since 1926, systematic contributions have averaged a lower cost basis than lump‑sum investing made at a random start date, reducing regret even when lump‑sum edges higher in bang‑for‑buck [12].
Equally important, DCA sidesteps timing paralysis. By automating cash‑flow into risk assets, the investor escapes decision fatigue and the tendency to hoard during crashes precisely when expected returns are highest [12].
Behavioural Guard‑Rails
Brokerage records show that the most active retail traders lag plain‑vanilla index funds by 3‑5 % a year, primarily through ill‑timed entries and exits [13]. Automation, pre‑committed rules, and written “if‑then” protocols fence off emotional trades, limit headlines from dictating strategy, and keep taxes and fees from compounding against you [13].
Building a Globally Diversified Starter Portfolio
Below is an illustrative 80 / 15 / 5 model for a 30‑year‑old with high tolerance and a 30‑year horizon. Swap tickers regionally if your broker lists different funds.
| Allocation | ETF Example | Annual Fee (ER) | Rationale |
| 60 % | Vanguard FTSE Global All-Cap (VT) | 0.07 % | One-ticket exposure to 9 000+ stocks |
| 20 % | iShares MSCI Emerging-Markets (IEMG) | 0.09 % | Growth kicker & currency diversification |
| 15 % | Vanguard Total US Bond (BND) | 0.03 % | Dampens equity volatility |
| 5 % | Vanguard Global REIT (VNQI) | 0.12 % | Tangible asset, inflation hedge |
Average blended fee: 0.07 % — far below the 1.0 % that typical actively managed funds charge.
Eight Practical Steps From Zero to Investor
Step 1 – Define Clear Goals and Secure an Emergency Fund: List time‑bound objectives (retirement at 65, €50 000 house deposit in 5 years) and hold 3‑6 months living costs in a high‑yield savings account.
Step 2 – Measure Risk Appetite: Complete a reputable questionnaire or simulate a 30 % portfolio drop. If nausea ensues, increase bond weight.
Step 3 – Open a Brokerage: Compare fees, fund availability, and fractional‑share support. Robinhood suits small US accounts; Fidelity offers full‑service depth; Interactive Brokers dominates globally.
Step 4 – Learn Core Platform Functions: Place mock trades, set up DRIP (dividend reinvestment), and explore research dashboards. Ten minutes now prevent fat‑finger mishaps later.
Step 5 – Buy Your Core ETFs: Execute purchases according to the target allocation. If deploying a lump sum feels scary, slice it into 6‑12 equal monthly tranches (DCA).
Step 6 – Automate Contributions: Link payroll or bank transfers so every payday adds to positions automatically — behaviourally powerful and tax‑efficient in retirement accounts.
Step 7 – Review Quarterly, Rebalance Annually: Look for drift beyond 5 %. Rebalancing in tax‑advantaged accounts avoids realised gains; otherwise harvest tax losses where possible.
Step 8 – Iterate and Educate: Read at least one classic a year (The Bogleheads’ Guide to Investing; A Random Walk Down Wall Street). Adjust allocation only for life events, not market gossip.
Advanced Layers: Taxes, Sustainability, and Factor Tilts
Taxes
A 1 % annual tax drag compounds to over 20 % of terminal wealth lost in 30 years [14]. Use ISAs, IRAs, 401(k)s, or local equivalents. In taxable accounts, favour index ETFs (in‑kind redemptions) and hold bonds in tax‑sheltered wrappers.
ESG & Sustainable Investing
Environmental, social, and governance (ESG) screens now govern over $35 trillion in assets globally [15]. You can replicate most broad‑market exposures through ESG indices at similar fees, though long history is limited.
Factor Tilts
Academic research identifies size, value, momentum, and quality premia [16]. Overweighting them via specialised ETFs can enhance risk‑adjusted returns but raises tracking error. Beginners should master vanilla beta first.
Common Pitfalls and How to Dodge Them
Performance Chasing: Buying last year’s winners is statistically a losing strategy [17].
Overtrading: The average retail trade gap versus buy‑and‑hold is −3.5 % annually [13].
Ignoring Costs: A 1 % advice fee plus a 1 % fund fee slashes a 7 % gross return to 5 % — halving end wealth over 40 years.
Leverage Misuse: Margin magnifies both gains and losses; 2020’s Robinhood incidents show how leverage can wipe accounts overnight.
Neglecting Rebalance: A 1990‑balanced 60/40 portfolio left untouched until 2021 drifted to 85 % equities, radically altering its risk.
Twelve‑Month Milestone Checklist
| Month | Action | Outcome |
| 1 | Open brokerage & fund $1,000 | Barrier to entry smashed |
| 2 | Purchase first ETF tranche | Become an owner, not observer |
| 3 | Draft Investor Policy Statement | Emotional anchor in volatility |
| 4 | Automate $300/month DCA | Compounding wheel turns |
| 6 | Read The Little Book of Common Sense Investing | Upgrade knowledge base |
| 9 | Review allocations, minor rebalance | Process over prediction |
| 12 | Celebrate progress & plan contribution increase | Positive reinforcement |
Parting Thoughts
Investing is deceptively simple: spend less than you earn, buy diversified assets, reinvest, and wait. The complexity lies in not sabotaging that simplicity when newsfeeds blare boom or doom. If this guide has done its job, you now possess not only the mechanics but the mind‑set to stay the course.
What single step will you take this week to move from intent to action? Share it in with your friends and family — public commitments increase follow‑through, and your plan may inspire someone else to start.
Happy compounding, and may the markets reward your patience.
References
U.S. Bureau of Labor Statistics. (2024). Consumer Price Index: All Urban Consumers 1990‑2023. Washington, DC.
Ibbotson, R. G., & Chen, P. (2003). Long‑run stock market returns: Participating in the real economy. Financial Analysts Journal, 59(1), 88‑98.
Dimson, E., Marsh, P., & Staunton, M. (2023). Triumph of the Optimists Global Investment Returns Yearbook. Credit Suisse.
Morningstar. (2024). Stocks, Bonds, Bills, and Inflation (SBBI) Yearbook. Chicago, IL.
Shiller, R. J. (2022). Irrational Exuberance (4th ed.). Princeton University Press.
S&P Dow Jones Indices. (2024). SPIVA U.S. Scorecard Year‑End 2023. New York, NY.
Nareit. (2024). U.S. REIT Annual Market Report 2013‑2023. Washington, DC.
World Gold Council. (2024). Gold Demand Trends Q1 2024. London, UK.
CoinDesk Research. (2024). Bitcoin Annual Returns 2014‑2023. New York, NY.
Markowitz, H. (1952). Portfolio selection. The Journal of Finance, 7(1), 77‑91.
Brinson, G. P., Hood, L. R., & Beebower, G. L. (1986). Determinants of portfolio performance. Financial Analysts Journal, 42(4), 39‑44.
Vanguard. (2020). Dollar‑cost averaging just means sticking to a plan. Valley Forge, PA.
Barber, B. M., & Odean, T. (2000). Trading is hazardous to your wealth. The Journal of Finance, 55(2), 773‑806.
Bogle, J. C. (2017). The little book of common sense investing (10th anniversary ed.). Wiley.
Global Sustainable Investment Alliance. (2023). Global Sustainable Investment Review 2022. Brussels, Belgium.
Fama, E. F., & French, K. R. (2015). A five‑factor asset pricing model. Journal of Financial Economics, 116(1), 1‑22.
De Bondt, W. F. M., & Thaler, R. (1985). Does the stock market overreact? The Journal of Finance, 40(3), 793‑805.
About the Author
Harry Negron is the CEO of Jivaro, a writer, and an entrepreneur with a strong foundation in science and technology. He holds a B.S. in Microbiology and Mathematics and a Ph.D. in Biomedical Sciences, with a focus on genetics and neuroscience. He has a track record of innovative projects, from building free apps to launching a top-ranked torrent search engine. His content spans finance, science, health, gaming, and technology. Originally from Puerto Rico and based in Japan since 2018, he leverages his diverse background to share insights and tools aimed at helping others.


