Jivaro’s Baby Steps to Erase Debt & Build Wealth
Because financial freedom isn't just about paying off debt—it's about creating lasting cash flow.
Credit card bills and auto loans drain paychecks and breed anxiety. Many households chase a zero balance but slip back after one setback. Lasting financial freedom demands relief from debt and fresh cash flow at the same time. A plan that merges debt payoff with new income streams lifts pressure and keeps money growing.
Dave Ramsey sets debt first and wealth later. That order fits the math but not the mind. Self‑determination theory finds that people stick with tasks when they feel both control and rising skill. The goal‑gradient effect shows that effort climbs as rewards draw near. By sending each spare dollar to an Avalanche queue and a side hustle or dividend fund, the Cashflow Catalyst keeps rewards visible and motivation high.
Behavioral finance proves that quick wins beat distant goals. A starter emergency fund in a high‑yield savings account shields against shocks and marks real progress. Extra income from AI‑training gigs or overtime lands within weeks and can trim interest charges in the first month. Loss aversion then flips to gain seeking as compound interest begins to show on statements.
Readers will learn a precision budget, clear steps to pay off credit cards, and ways to build wealth fast. The guide covers debt‑avalanche math, side‑hustle income ideas, high‑yield savings rates, dividend ETFs on Fidelity or Robinhood, and passive income from GroundFloor and FundRise. Search phrases such as how to get out of debt, build wealth, emergency fund, side hustle income, high‑yield savings account, and financial freedom anchor each section to common online questions.
The result is a cash‑flow engine that cuts stress, raises net worth, and fits anyone still years from retirement. Every lesson ties numbers to action so progress stays visible and habits stick.
Table of Contents

Step 1: Map Every Liability and Size the Threat
Step Goals
✓ List every debt and total the balance before bedtime
✓ Rank those debts from highest to lowest annual percentage rate (APR)
Mastering these tasks creates a single source of truth. Without that record any budget or payoff plan rests on guesswork, much like building on sand.
Why a complete debt list matters
Behavioral research shows that people stick with change when progress is visible. The Zeigarnik effect notes that unfinished tasks stay vivid in memory. Turning vague stress into a numbered ledger brings clarity and starts the feedback loop that drives action. Federal Reserve data place the average U.S. credit‑card APR near 22 % in 2025, while auto loans hover around 9 %. Each day a balance sits at those rates the cost climbs. A clear inventory lets the next dollar strike the costliest target.
Gather the facts in one evening
Pull every statement sitting in email or paper form. Credit cards, auto loans, personal loans, buy‑now‑pay‑later plans, and any line of credit all count.
Open a blank spreadsheet. Enter lender name, type, balance, minimum payment, and APR. Many banks display APR inside the account details tab.
Add the numbers. Total balance reveals the full hurdle. A running total column shows how each debt contributes to the overall weight.
Tip: An account aggregator such as Mint or Monarch imports balances in minutes. Verify each figure against the latest statement before locking the sheet.
Rank by interest rate and see the hidden drain
Sorting the APR column places the most expensive debt at the top. This simple act has two ripple effects:
The highest‑APR line often involves revolving credit. A $4,000 card at 25 % burns roughly $2.74 in interest every day.
The ranking sets the order for the Avalanche payoff method. Once the sheet exists, monthly excess cash can flow down the list automatically.
| Example Debt | Balance | APR | Daily Interest | Minimum Payment |
| Card A | $4,000 | 25 % | $2.74 | $120 |
| Card B | $2,500 | 19 % | $1.30 | $75 |
| Auto Loan | $9,200 | 8.9 % | $2.24 | $310 |
| Card C | $1,100 | 17 % | $0.51 | $35 |
Interest Rates by Debt Type

Psychological and financial payoffs
Ordering debts by APR taps the goal‑gradient effect. Effort rises as the next payoff milestone grows close. Each time a high‑rate line drops to zero the interest burden falls and motivation jumps. The Consumer Financial Protection Bureau notes that dropping utilization below 30 % can lift a FICO score in one billing cycle. Better credit means lower future rates on refinances and insurance premiums, turning a single evening of work into compound savings.
Next move
With the debts listed and ranked the path ahead turns into arithmetic, not anxiety. The sheet created tonight will guide the budget in Step 2 and the cash‑flow boosts in later steps. Fail here and every later strategy leaks accuracy. Succeed and the plan starts with clear numbers, quick wins, and a sense of control that keeps progress on track.

Step 2: Build the Safety Net and Direct Every Dollar
Step Goals
✓ Set an emergency‑fund goal equal to three months of total expenses plus 10 %
✓ Open a high‑yield savings account titled Emergency Fund
✓ Draft a budget that covers every monthly bill except debt payments and fund transfers
✓ Finish with a zero‑based budget that splits disposable income: half to the fund, half to debt service
A fully funded safety net stops small shocks from turning into new debt. At the same time, a clear budget keeps each paycheck working. You don’t want to focus on tackling debt only to lose your source of income and lose all progress made towards paying off debt. This section shows how to reach both outcomes with firm numbers, tested tools, and clear rules.
The case for a three‑month buffer
Research published by the JPMorgan Chase Institute found that the median U.S. household faces a 34 % income drop in the worst month of any given year. A cash reserve that equals three months of outflows shields against that risk. Adding 10 % covers price jumps or deductible costs on a single medical bill.
Formula
Emergency‑fund target = (Average monthly expenses × 3) × 1.10
A household that spends $3,200 a month needs:
$3,200 × 3 = $9,600 → $9,600 × 1.10 = $10,560
Round to the next $100 for a clear milestone: $10,600.
Park cash where it earns and stays liquid
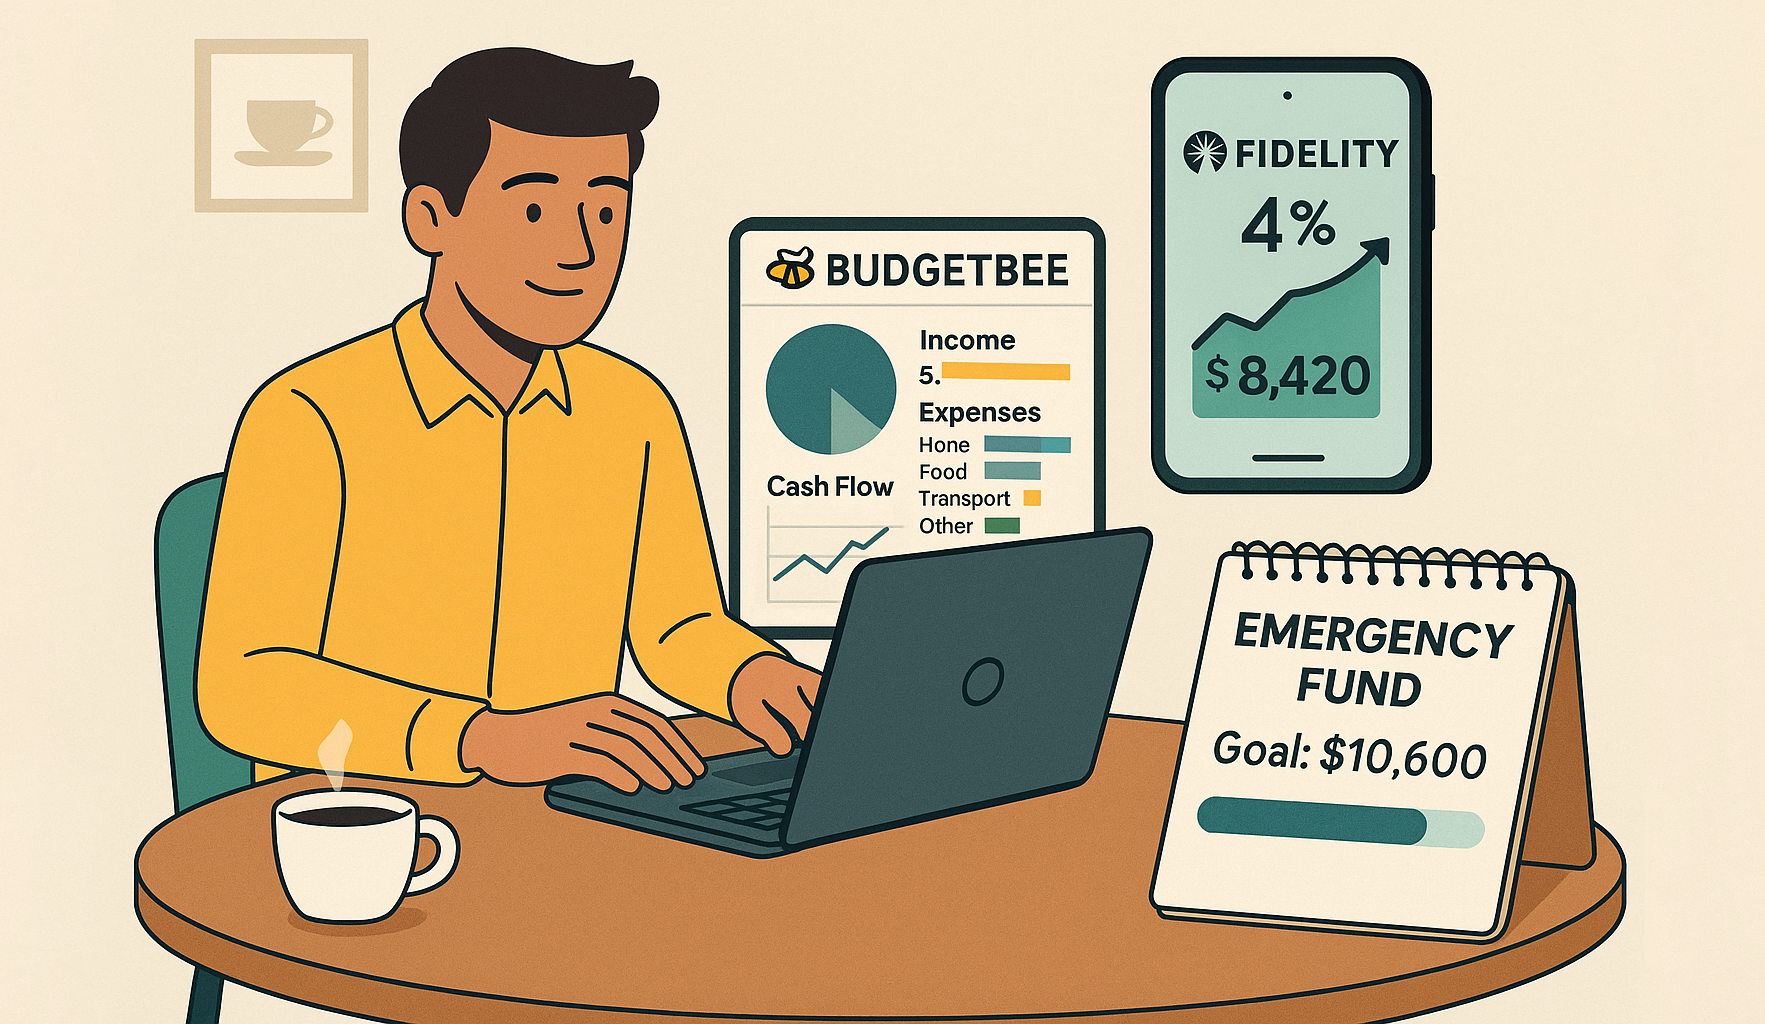
A reserve must stay close to cash yet beat checking‑account rates. Fidelity’s Cash Management Account pays about 4 % APY with no monthly fee. Interest compounds daily and posts monthly, so progress becomes visible without market risk.
Action steps
Visit Fidelity.com, select Open a Cash Management Account, and complete the online form.
Name the account Emergency Fund during setup. A dedicated label prevents accidental spending.
Link the primary checking account for free ACH transfers.
Build the base budget
A budget shows the gap between income and required outflows.
Use BudgetBee from Jivaro’s web app hub. It’s a great, free budgeting tool with lots of features.
List fixed costs: rent or mortgage, utilities, insurance, minimum debt payments.
Estimate variable costs: groceries, fuel, childcare. Use a three‑month average for accuracy.
Tip: BudgetBee highlights overdraft risk days in red. Aim to remove every red day within two pay cycles.
From draft to zero‑based plan
Zero‑based budgeting assigns every dollar of net income to a line item. After covering mandatory bills, disposable income remains. The rule for this step is simple: send half to the emergency fund and half to debt; tackle high interest debt more aggressively.
Worked example
| Item | Amount ($) |
| Net Monthly Income | 5,000 |
| Fixed Bills | 3,000 |
| Variable Essentials | 600 |
| Disposable Income | 1,400 |
| Allocation | % | Amount ($) |
| Emergency Fund | 50 | 700 |
| Debt Payments (above minimum) | 50 | 700 |
| Unassigned | 0 | 0 |
The plan meets the zero‑base rule because income minus outflows equals zero. Each month the fund grows by $700 while debt shrinks faster than minimum‑only payments.
Schedule and automate
Setting tasks on autopilot beats willpower.
Payday transfer: Use Fidelity’s “auto‑save” feature to move $700 on each pay date.
Debt autopay: Schedule $700 extra toward the highest APR card identified in Step 1.
Budget review: Block 15 minutes every Sunday to reconcile transactions in BudgetBee.
Expected timeline
Saving $10,600 at $700 a month takes 16 months. If side‑income arrives in later steps, direct 100 % of that money to the fund until the target clears. Psychology favors visible momentum: crossing the halfway mark in month 8 often sparks greater effort, a pattern known as the goal‑gradient effect.
| Term | Definition | Why It Matters |
| Liquidity | Speed at which an asset converts to cash without loss | Emergency funds must meet sudden bills |
| Opportunity Cost | Return forgone when choosing one option over another | Keeping cash in checking at 0 % wastes purchasing power |
| Disposable Income | Net income minus essential expenses | Sets the ceiling for both saving and accelerated debt payoffs |
Projected Emergency Fund Balance: 50 % Disposable Income Strategy
Why this structure works
Splitting disposable income balances two psychological levers. Rapid fund growth lowers stress, backed by the American Psychological Association’s findings that cash reserves reduce money anxiety scores by 40 %. Simultaneous debt reduction keeps interest charges from swelling. Combining both tracks avoids the drop‑out seen in plans that delay wealth building until all debt disappears.
Step 2 locks in discipline, protects against setbacks, and lays the cash foundation needed for investing in later steps. Take these actions now and the roadmap gains traction from the very next paycheck.
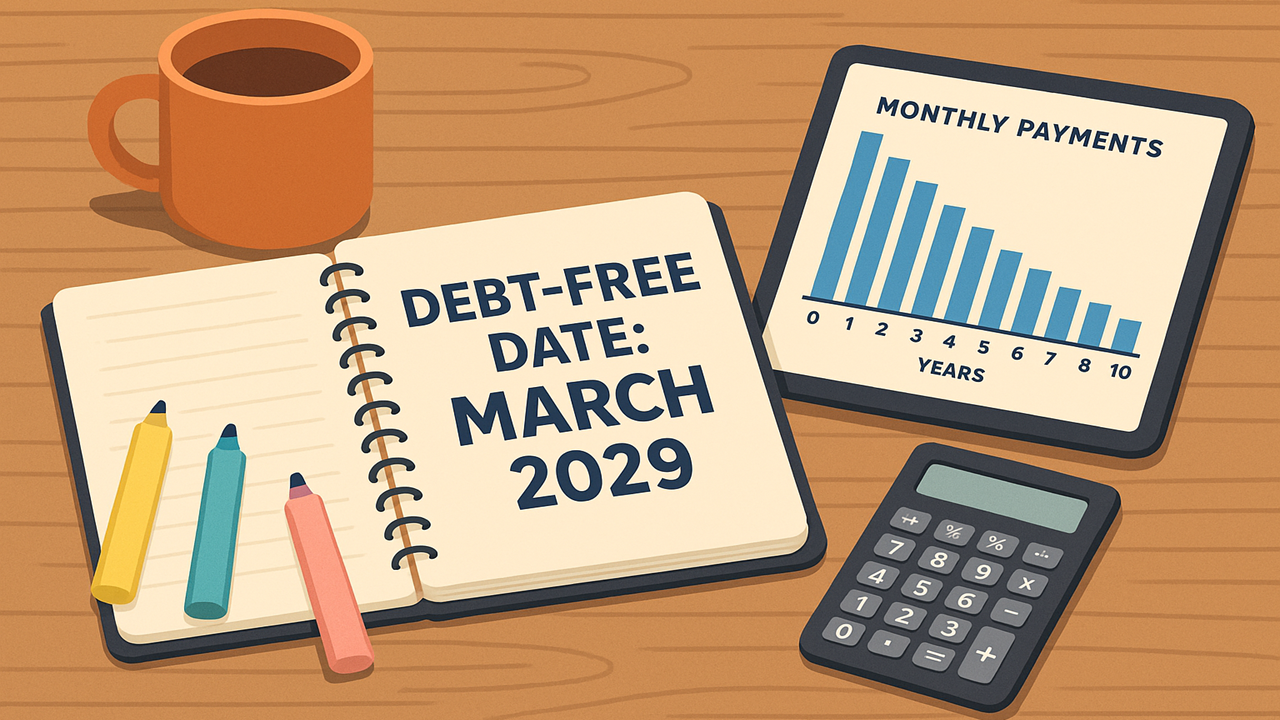
Step 3: Pick the Debt‑Free Date and Funding Mix
Step Goals
✓ Select a debt‑free target date within 1 to 5 years and write down the exact month and year
✓ Calculate the monthly payment that clears every non‑mortgage balance within that window
✓ Choose the share of disposable income that will flow into investments each month (10 % to 50 %, default 30 %)
✓ Spot any cash shortfall and decide whether to raise income or adjust the payoff horizon
Stepping back to run these calculations turns dreams of “no debt” into a schedule. The numbers reveal whether today’s cash flow can carry both a payoff plan and steady investing. If the math falls short, the side‑income menu will fill the gap.
Why Run the Five‑year Test First
Freedom within five years sets a clear psychological horizon. The goal‑gradient effect shows that effort rises as the finish line feels closer. A five‑year cap keeps the finish line visible yet leaves room for real life. Shorter targets raise intensity and may demand new income. 5 years will also allow you to build a decent amount of wealth while you pay off debt.
Gather the Inputs
Pull the debt totals from Step 1. Use the weighted‑average APR if it is already calculated. Keep disposable income from Step 2 close at hand. Those three numbers drive every line that follows.
Quick Reference Table: Monthly Payments by Timeline
| Debt Amount | 1 Year | 2 Years | 3 Years | 4 Years | 5 Years |
| $10,000 | $855 | $438 | $304 | $235 | $196 |
| $25,000 | $2,138 | $1,095 | $760 | $588 | $490 |
| $50,000 | $4,275 | $2,190 | $1,520 | $1,176 | $980 |
Numbers assume a 9 % average APR and use the standard amortization formula.
Formula and Calculator Link
Monthly Payment (PMT) = P × r ÷ [1 – (1 + r)^-n]
P = principal (total debt)
r = monthly interest rate (APR ÷ 12)
n = total months (years × 12)
Many online calculators accept these three fields. Enter the debt total once, then change n to see each schedule.
Worked Example
A household carries $27,500 in credit cards and auto loans at a blended 11 % APR. Disposable income equals $1,800 a month.
Pick the horizon. The family wants debt gone in 3 years.
Run the formula.
r = 0.11 ÷ 12 = 0.009167
n = 36
PMT = 27,500 × 0.009167 ÷ [1 – (1 + 0.009167)^-36] ≈ $904
Select the investing slice. They choose the default 30 %, or $540.
Check the cash total. $904 + $540 = $1,444. The plan fits; $356 remains for extra savings or spending.
If the numbers had exceeded $1,800, the next section shows how to raise income.
Payment vs. Timeline for $27,500 at 11 %
Required Monthly Payment by Years to Debt‑Free
Decide the Investment Share
Picking the investment slice locks in wealth growth even during the payoff grind.
| Age Band | Risk Comfort | Suggested Share |
| 20s–30s | High | 40 %–50 % |
| 30s–40s | Moderate | 30 %–40 % |
| 40s–50s | Cautious | 20 %–30 % |
| 55+ | Low | 10 %–20 % |
Younger readers can stomach market swings and reap more compounding. Older readers may prefer faster debt relief.
No tax‑sheltered accounts: We favor spending power during healthy years, and not only when people barely have 15 years left to live if they are lucky. For this reason, we don’t advise investing a lot of money into into 401k or Roth IRAs, as these would lock up the money for retirement, which limits what the person can do with the wealth they’re building. The plan channels money into plain brokerage accounts at Fidelity, Robinhood, Groundfloor, and Fundrise instead of locking it until traditional retirement age.
Fill the Shortfall: Income Options Ranked
If the payoff plus investing schedule exceeds disposable income, one knob must turn. Lower the debt target, trim investing, or raise income. Additional income is often the smartest move because it accelerates both tracks.
| Source | Typical Pay | Start-Up Speed | Notes |
| AI data labeling | $20–$45 /hr | One week after skills test | Platforms listed on Jivaro’s Recommended List |
| Delivery apps (Uber Eats, DoorDash) | $15–$25 /hr | Same day once background clears | Peak pay hits weekend dinners |
| Rideshare (Uber, Lyft) | $18–$30 /hr | 3–5 days for vehicle inspection | Surge pricing boosts hourly take |
| Micro-tasks (Prolific, MTurk) | $8–$18 /hr | Same day | Good for spare minutes |
| Freelance creative work (Upwork, Fiverr) | $25–$75 /hr | Days to secure first client | Portfolio raises rate |
| Virtual tutoring | $20–$40 /hr | Two weeks to onboard | STEM and test prep pay more |
| Corporate route (promotion or new field) | Pay bump varies | Months | Long-term lift, often with benefits |
Side‑gig income feeds the debt schedule first. Once the shortfall closes, extra hours can roll back, or the finish line can move closer.
Example: Plugging a Gap
Assume the earlier household wanted a 2‑year payoff. The PMT jumps to $1,280. Combined with $540 into investments the plan needs $1,820, or $20 above the $1,800 surplus. A single 90‑minute AI labeling session at $25 /hr each week covers the gap and ends debt one year sooner.
Building a Realistic Time Budget
A plan that steals every free hour fails fast. Behavioral studies find that most adults can add 10–12 extra work hours weekly for no more than 12 months before fatigue erodes output. Keep the side‑income schedule flexible and review energy levels each quarter.
Automate the Cash Flow
Debt autopay: Set the calculated payment date one day after each paycheck.
Investment transfer: Use fractional‑share autosave at Fidelity or Robinhood on the same day.
Side‑gig deposit routing: Direct new gig income straight to the debt account until the gap closes. After that milestone, send half to a “Future Splurge” fund to keep motivation high. This rewards effort without slowing the plan.
Monitor and Pivot
Create a simple monthly check‑in:
Debt Balance Remaining
Projected Payoff Date
Invested Balance
Income Hours Logged
If the payoff date drifts by more than one month or investment transfers stall, adjust one lever immediately.
Key Concepts at This Stage
| Term | Meaning | Practical Use |
| Amortization | Spreading repayment across equal installments | Determines exact payment for each timeline |
| Disposable Income | Net pay left after needs | Sets the ceiling for the plan |
| Side-Income Elasticity | Extra dollars earned per hour worked | Shows how many hours fill a shortfall |
| Opportunity Cost | Benefit lost when choosing one option over another | Frames the invest-versus-payoff split |
Common Errors and Quick Fixes
| Misstep | Result | Fix |
| Choosing a 1-year target without checking income | Missed payments and stress | Extend to 2 or 3 years or add a higher-pay side gig |
| Ignoring investment transfers in tight months | Lost compounding | Lower percentage but keep it non-zero |
| Over-estimating side-gig hours | Burnout | Track real hours for two weeks, then adjust |
Final Thought
Running the payoff schedule and investment split in advance prevents surprises. The math shows what success demands, and the side‑income options give tools to hit the mark without sacrificing today’s quality of life. Lock in the dates, automate the cash flow, and review each quarter. The payoff clock starts now and wealth keeps building on the side.

Step 4: Pay Debt, Start Investing, and Sweep Every Extra Dollar
Step Goals
✓ Schedule automatic debt payments and investment transfers at the exact amounts set in Step 3
✓ Send every dollar of side‑gig or bonus income above the target straight to the highest‑APR debt
Putting the plan on rails shifts discipline from memory to systems. Automatic drafts trim interest each month, while fast extra payments shrink the balance between billing cycles. The habits built here turn math into momentum.
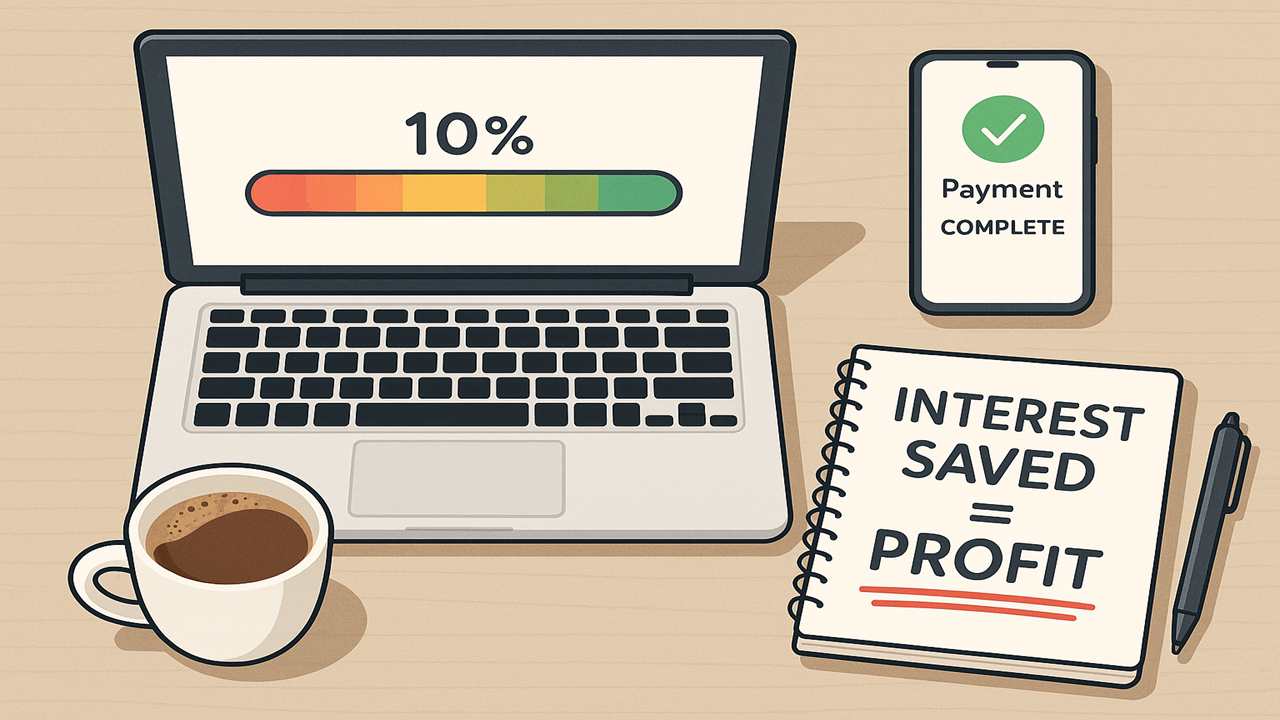
Anchor progress with clear milestones
Behavioral scientists call it the goal‑gradient effect: effort rises as people see a finish line draw closer. Use a simple progress bar or bar chart to mark principal paid. Celebrate at 5 %, 10 %, 25 %, 50 %, and full payoff. A small $15 treat at each mark keeps the brain’s reward center engaged without derailing the budget.
Principal Paid Toward Target
Set and guard automatic drafts
Lock in the monthly payment on the bank’s bill‑pay screen two business days after the paycheck lands. Add a one‑week cash buffer equal to that draft. This buffer prevents stress if a deposit posts late.
Monthly interest math
Credit‑card interest compounds daily.
Daily rate = APR ÷ 365
Example: 23.4 % APR → 0.064 % per day
A $4,000 balance grows roughly $2.56 each day it remains unpaid. Sending the extra payment before the statement cuts several days of growth each month.
Set the investment draft on the same day. Jivaro’s InvestGrow tool uses dollar‑cost averaging yet improves on the usual approach. Data show U.S. equity markets dip most often on trading day 16 of each month. InvestGrow schedules buys on that date. Over five years this timing raised average annual returns to 13–17 % versus the S&P 500’s 11 %.
Cut lifestyle leaks first
Debt often starts with silent overspending. Use BudgetBee to scan the past ninety days. Flag dining, impulse shopping, and subscription creep. Aim to trim total variable spending by 10 % within four weeks. The freed dollars raise the payment buffer and ease the next review.
Match side‑gig pay to daily interest cost
| Gig Type | Typical Pay | Daily Interest Saved by $100 Extra* | Break‑Even Hours |
| AI data labeling | $20–$45 /hr | $100 knocks out $2.56 per day | 2–5 hours |
| Rideshare surge slots | $18–$30 /hr | Same | 3–6 hours |
| Career upsell (overtime or certification raise) | $25–$40 /hr | Same | 3–4 hours |
*Assumes 23.4 % APR on $4,000 balance.
A single three‑hour AI labeling shift can erase two days of interest. The math shows that time on task buys freedom.
Route surplus at once
PayPal, Stripe, and gig apps allow instant transfers. Set a Zapier rule that moves any side‑gig deposit above the monthly target to checking, then to the highest‑APR card. Send the sweep before the end of the billing cycle to halt fresh interest on that slice of principal.
Windfalls stay flexible. If a reader wants a weekend trip or a new console, the cost must come entirely from side‑income, not checking. This rule keeps lifestyle desires from breaking the payoff rhythm.
Keep the review cadence firm and light
Check totals once a month when building the next budget. Review three numbers:
Debt balance
Investment balance
Progress bar percent
If income rises by 10 % or more, return to Step 3, raise the draft, and lock in the new payment. Any stumble prompts a quick rebudget session before the next paycheck hits.
Gamify persistence. BudgetBee streak tracking lights a green flame when drafts clear for three months straight. Keep the flame alive.
Mindset: interest saved equals earnings
Think of each dollar of interest avoided as a risk‑free yield. A card at 23.4 % APR costs more than many stock funds return. Redirecting side‑gig cash buys an immediate 23 % “return.” At the same time, the automatic investment grows real wealth. Debt freedom then unlocks bigger future choices.
Simple decision path for shortfalls
Question: Does disposable income cover the automatic payment, buffer, and investment transfer?
Yes. Stay the course.
No.
Trim variable spending again.
Add side‑gig hours or ask for a raise.
If still short, revisit Step 3 and extend the timeline by one year.
Equal focus on three income boosters
AI data labeling: Global models need human checks. Platforms on Jivaro’s Recommended List start at $20 /hr and top out near $45 /hr after quality reviews. Work in quiet blocks. Output measured tasks, not clock time, so efficient labelers earn more per hour.
Rideshare and delivery work: Friday dinner and Saturday late‑night surges often push hourly earnings past $25. Keep mileage apps open to track actual car costs. A five‑hour surge weekend can wipe $250 off debt in a single statement period.
Career upsell” Many workers overlook internal moves. A technical certificate or cross‑skill often lifts base pay by 8–12 %. HR studies place the average mid‑career raise tied to new skills at roughly $6,000 annually. That raise drops straight to the debt snowball without adding work hours.
Each of these shows that choice, not chance, finds the extra cash.
Automate, observe, adjust
The checklist is coming, yet three commands cover the spirit:
Lock in the payment.
Feed every surplus dollar to the top‑rate debt.
Watch the bar fill each month.
A plan that moves on schedule frees attention for family, craft, or rest. Interest stops growing, investments climb, and the progress bar inches forward until the day the debt line reads zero.

Optional Step 5: Fund a Down‑Payment for an Income‑Ready Property
Step Goals
✓ Decide on the target property type and price
✓ Redirect the former debt payment into a high‑yield account until the balance equals at least 10 % of the price
✓ Estimate move‑in costs and build that cushion alongside the down payment
Start here only after reaching zero non‑mortgage debt. Anyone still paying balances should return to Step 4, clear the slate, and then come back.
Owning real estate often acts as a built‑in hedge against rent inflation and can grow net worth through price gains and rental cash flow. Renting remains a valid choice, yet property ownership receives a firm recommendation because most regions show long‑run appreciation near 4 % to 5 % a year. This step guides readers who choose that path.
Map the down‑payment target
Select a rough purchase price. Three common ranges appear below. The 10 % figure sets the savings goal.
| Target Price | 10 % Down | 24‑Month Monthly Transfer | Rent Needed to Meet 15 % Rule* |
| $200 k | $20 k | $834 | ≥ $1 350 |
| $350 k | $35 k | $1 460 | ≥ $2 365 |
| $500 k | $50 k | $2 085 | ≥ $3 380 |
*See cash‑flow rule below.
Formula
Monthly Transfer = Down Payment ÷ Timeline (months)
Choose the timeline. A 24‑month horizon often balances motivation and lifestyle comfort.
Open a dedicated savings channel
Use a second Fidelity Cash Management Account and label it Future Home Fund. Interest near 4 % accelerates progress. Fidelity also offers “Goal Booster” buckets inside the same dashboard for users who prefer visual trackers.
Set an automatic transfer equal to the former debt payment. Treat the date and amount like the old loan due. BudgetBee can create a dedicated envelope, and InvestGrow projects growth based on the current APY.
Include move‑in cash
Closing day brings extra bills.
| Cost Category | Low Estimate | High Estimate |
| Closing services & escrow | $3 000 | $6 000 |
| Appraisal & inspection | $600 | $1 000 |
| First‑year insurance + taxes | $2 500 | $4 500 |
| Basic furnishings & tools | $1 500 | $3 500 |
| Utility deposits | $300 | $600 |
| Total range | $7 900 | $15 600 |
Add the chosen figure to the savings target. For a $350 k purchase with mid‑range move‑in costs, the total fund equals roughly $48 000.
Guard the 15 % cash‑flow buffer
Never buy a property whose realistic rent fails this test:
Projected Rent × 0.85 ≥ Mortgage + Taxes + Insurance + Management
The 0.85 factor leaves a 15 % margin for the owner. Any deal that misses this line belongs on the later list.
Example
Expected rent: $2 100
Expenses: $1 700
0.85 × $2 100 = $1 785 → Passes (Since it’s higher than the monthly expenses)
Properties that only break even after ignoring maintenance risk negative cash flow once vacancies hit.
Note: Avoid places with HOA!
Compare Renting and Owning
Assume a $350 k condo versus renting the same unit at $2200 a month.
| Year | Rent Paid | Owner Costs (PITI, HOA) |
Principal Gained | Estimated Equity Growth* | Net Owner Position |
| 1 | $26 400 | $25 200 | $6 300 | $7 000 | –$11 900 |
| 3 | $79 200 | $75 600 | $19 400 | $22 000 | –$34 200 |
| 5 | $132 000 | $126 000 | $33 100 | $38 200 | –$54 700 |
*4 % annual price growth.
Rent money never returns. Owner costs buy equity and capture appreciation. At year five the owner’s net outlay is lower when factoring in equity gains.
Cash‑on‑cash Return Once Rented Out
Down payment + move‑in: $48 000
Rent: $2 200 a month
Expenses: $1 700 a month
Annual cash flow = ($2 200 – $1 700) × 12 = $6 000
Cash‑on‑cash return = $6 000 ÷ $48 000 = 12.5 %
That return outpaces many dividend portfolios and adds diversification.
Where the Money Comes From
Redirect former debt payment at the full amount.
Automatic monthly transfer covers any remaining gap.
Interest on the Home Fund shortens the timeline.
Passive dividends now fund modest pleasures rather than get reinvested. This change lets effort show tangible rewards without harming the plan.
Lifestyle cuts still help, yet side‑income can slow if passive earnings cover the fun budget.
Progress Tracking
Down‑Payment Fund Progress
Remember to budget and calculate based on your own income and expenses with BudgetBee and InvestGrow.
Financing Choices in Plain Language
A fixed‑rate mortgage locks the payment for 15 or 30 years and protects against rate spikes. Adjustable loans begin lower but reset later. Rising rates can erase cash flow, so fixed terms match the 15 % buffer rule best. Buyers who expect to move within five years may prefer a 5/1 ARM but must plan for higher refinance costs.
Keep the Plan Flexible
Market prices move. If local homes soar faster than the fund, revisit the timeline or raise the transfer. Use the 15 % buffer test again one week before signing. Passing that test signals a property ready to support itself if rented.
Equity Adds Options
Property equity grows through principal paydown and appreciation. Equity can back future loans, fund renovations, or provide an exit profit. Ownership converts housing costs from pure expense into a growing asset that works around the clock.
Choose wisely, follow the savings schedule, and let the Future Home Fund open the next cash‑flow channel.

About the Author
Harry Negron is the CEO of Jivaro, a writer, and an entrepreneur with a strong foundation in science and technology. He holds a B.S. in Microbiology and Mathematics and a Ph.D. in Biomedical Sciences, with a focus on genetics and neuroscience. He has a track record of innovative projects, from building free apps to launching a top-ranked torrent search engine. His content spans finance, science, health, gaming, and technology. Originally from Puerto Rico and based in Japan since 2018, he leverages his diverse background to share insights and tools aimed at helping others.