Investing Basics: What is Compounding
Why Compound Growth Matters
Albert Einstein allegedly dubbed compound interest “the eighth wonder of the world.” Whether or not he said it, the quotation resonates because compounding is the rare financial phenomenon that turns time into an accelerant rather than a cost. Every dollar that stays invested earns returns, those returns earn further returns, and—given enough cycles—the curve of wealth turns from linear to exponential. This guide unpacks exactly how that curve forms, how to ride it across different asset classes, and how to keep negative forces from flattening it.
Table of Contents
Compounding 101 – Definitions & Core Concepts
Before diving into formulas, let’s anchor the terminology.
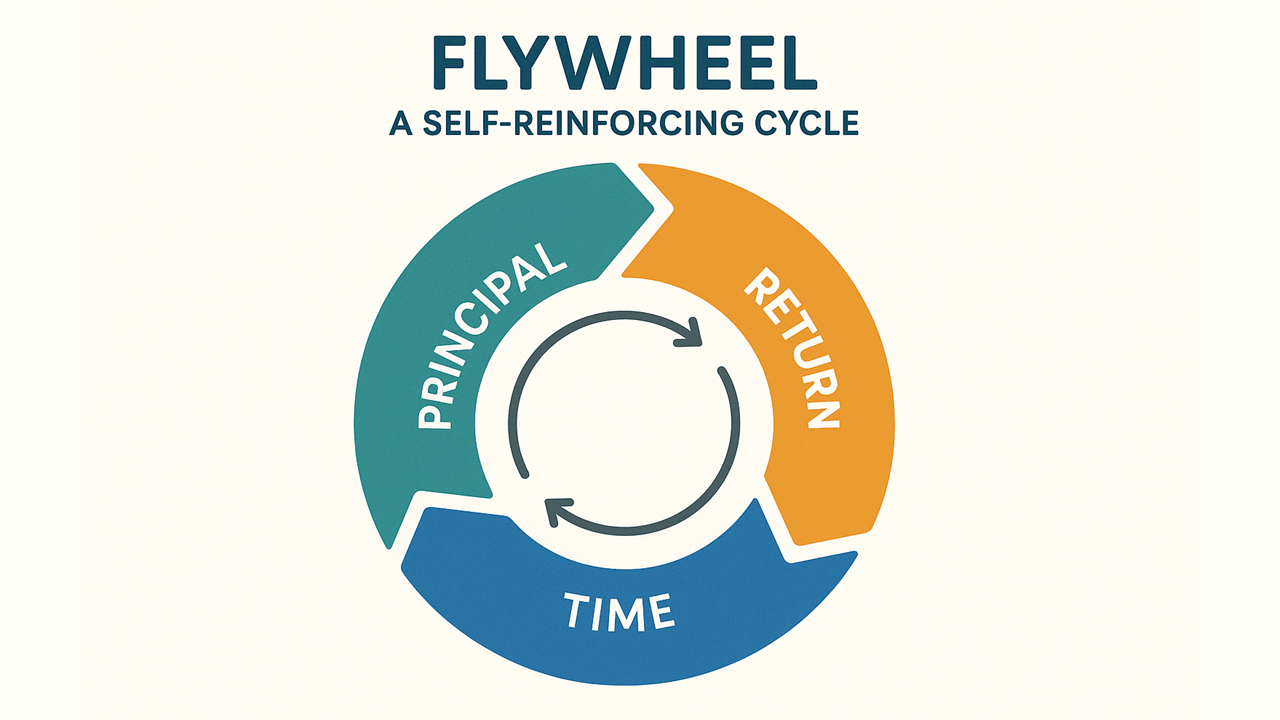
Compounding occurs whenever earnings are reinvested so they themselves generate additional earnings. Unlike simple interest—which pays interest on the original principal only—compound interest grows the base each period, causing subsequent gains to be calculated on a progressively larger amount. The engine has three inputs:
Principal – the money already working.
Rate of return – the annual (or periodic) percentage gain or loss.
Time – the number of compounding periods.
The interaction of these variables underlies every illustration that follows.
Simple Interest vs. Compound Interest in Action
To see the difference, compare two $10,000 deposits earning 5 % annually for a decade—one reinvests gains, the other withdraws them.
| Year | Compounded Balance | Simple-Interest Balance |
| 0 | $10,000 | $10,000 |
| 1 | $10,500 | $10,500 |
| 2 | $11,025 | $11,000 |
| 3 | $11,576 | $11,500 |
| 5 | $12,763 | $12,500 |
| 10 | $16,289 | $15,000 |
After ten years, compounding adds an extra $1,289—and that gap widens disproportionately as the horizon extends.

The Mathematics of Exponential Growth
Effective Annual Rate & Periodic Compounding
The general formula for future value with discrete compounding is:

Where:
PV = present value (initial principal)
r = nominal annual rate
m = number of compounding periods per year
t = years invested
Increasing m (monthly vs. annually) marginally boosts the effective rate, but increasing t produces the dramatic lift because the exponent grows.
Rule of 72
For back‑of‑the‑envelope doubling time:

At 9 % annual growth, money doubles roughly every eight years; at 3 %, it takes 24.
Time & Rate: The Two Turbo‑Boosters
Compounding is a two‑cylinder engine: time and rate of return. Remove either cylinder and growth sputters; feed both and the engine roars.
Why Time Matters More Than Talent
Because compounding is exponential, doubling periods multiply wealth far faster than most people intuit. Consider two investors:
| Investor | Start Age | Annual Return | Annual Contribution | Ending Age | Portfolio Value* |
| Amy | 25 | 7 % | $6,000 (max IRA) | 65 | $1.28 M |
| Ben | 35 | 9 % (two extra points of skill) | $6,000 | 65 | $1.05 M |
*Assumes monthly contributions, returns compounded monthly.
Even with a higher rate, Ben never surpasses Amy, because she owns an extra decade of compounding cycles. This is the mathematical proof behind the common planner’s mantra: “Your first dollar is your most powerful dollar.”
Small Rate Tweaks, Big Dollar Outcomes
On the flip side, when time is fixed (e.g., a 30‑year retirement portfolio), incremental bumps in return still produce eye‑popping gaps:
| Annual Return | Value After 30 yrs | Multiple of Original |
| 4 % | $324,340 | 3.24× |
| 6 % | $574,349 | 5.74× |
| 8 % | $1,006,266 | 10.06× |
| 10 % | $1,744,940 | 17.45× |
A two‑point lift—from 6 % to 8 %—does not add two‑points‑worth of dollars; it nearly doubles the ending wealth. That non‑linear payoff is why many fiduciaries spend as much time shaving fees (thereby raising net return) as they do chasing gross performance [4].
Formula Corner
For any periodic return r and timeline t, the effective growth factor is:

Graph it and you’ll notice the curve barely lifts at first—a “flat valley”—then tilts sky‑ward. Experienced investors nickname this inflection the “kneecap” of the curve; the longer you stay invested, the closer you get to that vertical wall of accelerated gains [2].

Compounding Across Asset Classes
Compounding is universal, but each asset class has a different mechanism and cadence for reinvesting cash flows. Understanding those mechanics lets you patch “leaks” that slow the snowball.
Savings & Money‑Market Accounts
Savings accounts compound frequently (often daily) and quote an APY that already folds in that frequency. At today’s 4 %–5 % online‑bank yields, $10,000 grows to about $12,200 in five years with zero market risk.
Best practices:
Rate shop annually; a 0.50 % APY difference costs $1,500 of interest on $50k over a decade.
Park only your emergency fund here; higher‑return vehicles beat inflation over long horizons.
Growth Comparison on a $25k Balance Over 10 Years
Stocks & Dividend Reinvestment
Equities add a second fuel line: reinvested dividends plus price appreciation. From 1993–2023 the S&P 500 returned 10.2 % annually with dividend reinvestment versus 8.0 % price‑only [2]. That 2.2‑point gap compounded for 30 years means:
Price‑only: $100k → $1.0 M
Price + DRIP: $100k → $1.9 M
Nearly double the wealth simply by clicking “reinvest” in your brokerage settings.
Yield vs. Growth Trade‑Off
High‑yield stocks (utilities, REITs) pay more cash today; growth stocks (tech) reinvest earnings internally. A balanced portfolio blends the two so that some cash can be reinvested each quarter, while growth engines grind silently in the background.
Dollar‑Cost DRIP
Combining automatic monthly buys and DRIP creates a “double‑compounder”—contributions grow the share base, dividends amplify it. Morningstar modeling shows a 25‑year‑old investing $500 /mo in an S&P 500 index with DRIP ends at age 65 with $1.7 M; without DRIP the figure drops to $1.2 M [1].
Cumulative Return of S&P 500
Mutual Funds / ETFs
Index funds simplify compounding: capital gains and income distributions can be set to auto‑reinvest, growing the share base without manual trades. Their low fees also preserve more of each return cycle.
Funds institutionalize compounding:
| Feature | Impact on Compounding |
| Automatic Reinvestment Option | Converts dividends/capital gains into more fund shares on distribution date. |
| Fractional Shares | Every penny is reinvested—no idle cash slippage. |
| Low Cost (Index ETFs ≤ 0.05 %) | Keeps more return to snowball; a 1 % fee drag cuts a 30-yr nest egg by ~25 % [4]. |
| Built-in Diversification | Reduces big drawdowns, preventing panic selling that breaks the compounding chain. |
Case Study: Vanguard’s Total Stock Market Index (VTSAX) compounded at 8.1 % (after fees) from 2000‑2024 with reinvestment despite two bear markets. A $10k lump would be $70k; add $200 monthly contributions and the ending value tops $235k—a live demonstration of contributions + reinvestment synergy.
Bonds & Fixed Income
Bonds generate scheduled coupon cash that requires investor action to reinvest—otherwise growth stalls. Coupon payments normally arrive as cash; compounding happens only if the investor buys additional bonds. Exceptions include zero‑coupon bonds and Series I savings bonds, which compound internally until redemption [3].
| Instrument | How Interest Compounds | Ideal Use-Case |
| Bond Fund / ETF | Fund manager automatically reinvests coupons into new issues. | Hands-off retirement accounts. |
| Individual Coupon Bonds | Investor must manually reinvest payments. | Liability-matching ladders. |
| Zero-Coupon & I-Bonds | Interest accrues inside the security; redeemed at maturity. | College funding, long-term tax deferral. |
Example: $50,000 in a bond fund yielding 4 % grows to $110,000 in 20 yrs via reinvestment versus $90,000 if coupons are spent—a $20k compounding premium.
Rising‑Rate Environments
When rates climb, new coupons are reinvested at higher yields, accelerating the snowball—a built‑in hedge against price declines. This “income reset” is why bond funds often recover faster than headline price charts imply.

The Dark Side: Inflation, Fees & Debt
Compounding also magnifies erosive forces.
Inflation: At 3 % CPI, purchasing power halves in about 24 years. Invest where expected returns exceed inflation.
Fees: A 1 % annual expense ratio on a 7 % nominal return shaves the effective rate to 6 %, cutting the 30‑year outcome by 30 % [4].
Debt Interest: Credit‑card APRs of 20 % double balances every ~3.6 years if unpaid. Eliminating high‑rate debt is tantamount to earning a risk‑free high return.
Practical Strategies to Harness Compounding
Start Now, However Small – $100 monthly at 8 % grows to $146k in 30 years; waiting 10 years halves that outcome.
Automate Reinvestment – Enroll in DRIPs or fund reinvest programs.
Prioritize Low‑Cost Vehicles – Index ETFs often charge <0.10 % vs. 1 %+ for active funds.
Use Tax‑Advantaged Wrappers – 401(k)s, IRAs, ISAs shelter gains, letting gross returns fully compound.
Stay the Course – Market timing interrupts compounding. Historical data show missing even the 10 best days per decade can cut long‑term equity returns by nearly half [5].
Tools, Calculators & Further Reading
InvestGrow (Jivaro) Compound Interest Calculator – customizable periods and contribution amounts.
FINRA Fund Analyzer – quantifies fee drag over decades.
Academic Paper: Do Dividend-Paying Stocks Outperform Non-dividend Stocks in the Long Run?
The Quiet Superpower of Patient Capital
Compounding rarely makes headlines because its drama happens slowly, then all at once—like an avalanche that began as a snowflake. Decades of patient reinvestment convert ordinary paychecks into extraordinary portfolios, not through alchemy but through arithmetic repeated relentlessly. In a world obsessed with shortcuts, compounding whispers a different lesson: the surest way to create future freedom is to let small wins echo through time. Start the echo today, protect it from fees and inflation, and future‑you will thank present‑you for harnessing the quiet superpower of patient capital.
References
Investing.com. (2024). Dividend Reinvestment Explained.
Dimson, E., Marsh, P., & Staunton, M. (2024). Global Investment Returns Yearbook. Credit Suisse.
U.S. Treasury. (2023). Series I Savings Bond Rate Announcement.
Bogle, J. C. (2018). The Little Book of Common Sense Investing. Wiley.
JP Morgan Asset Management. (2025). Guide to the Markets, Q1 Update.
Disclaimer: This article provides general educational information and is not personalized financial advice.

About the Author
Harry Negron is the CEO of Jivaro, a writer, and an entrepreneur with a strong foundation in science and technology. He holds a B.S. in Microbiology and Mathematics and a Ph.D. in Biomedical Sciences, with a focus on genetics and neuroscience. He has a track record of innovative projects, from building free apps to launching a top-ranked torrent search engine. His content spans finance, science, health, gaming, and technology. Originally from Puerto Rico and based in Japan since 2018, he leverages his diverse background to share insights and tools aimed at helping others.