
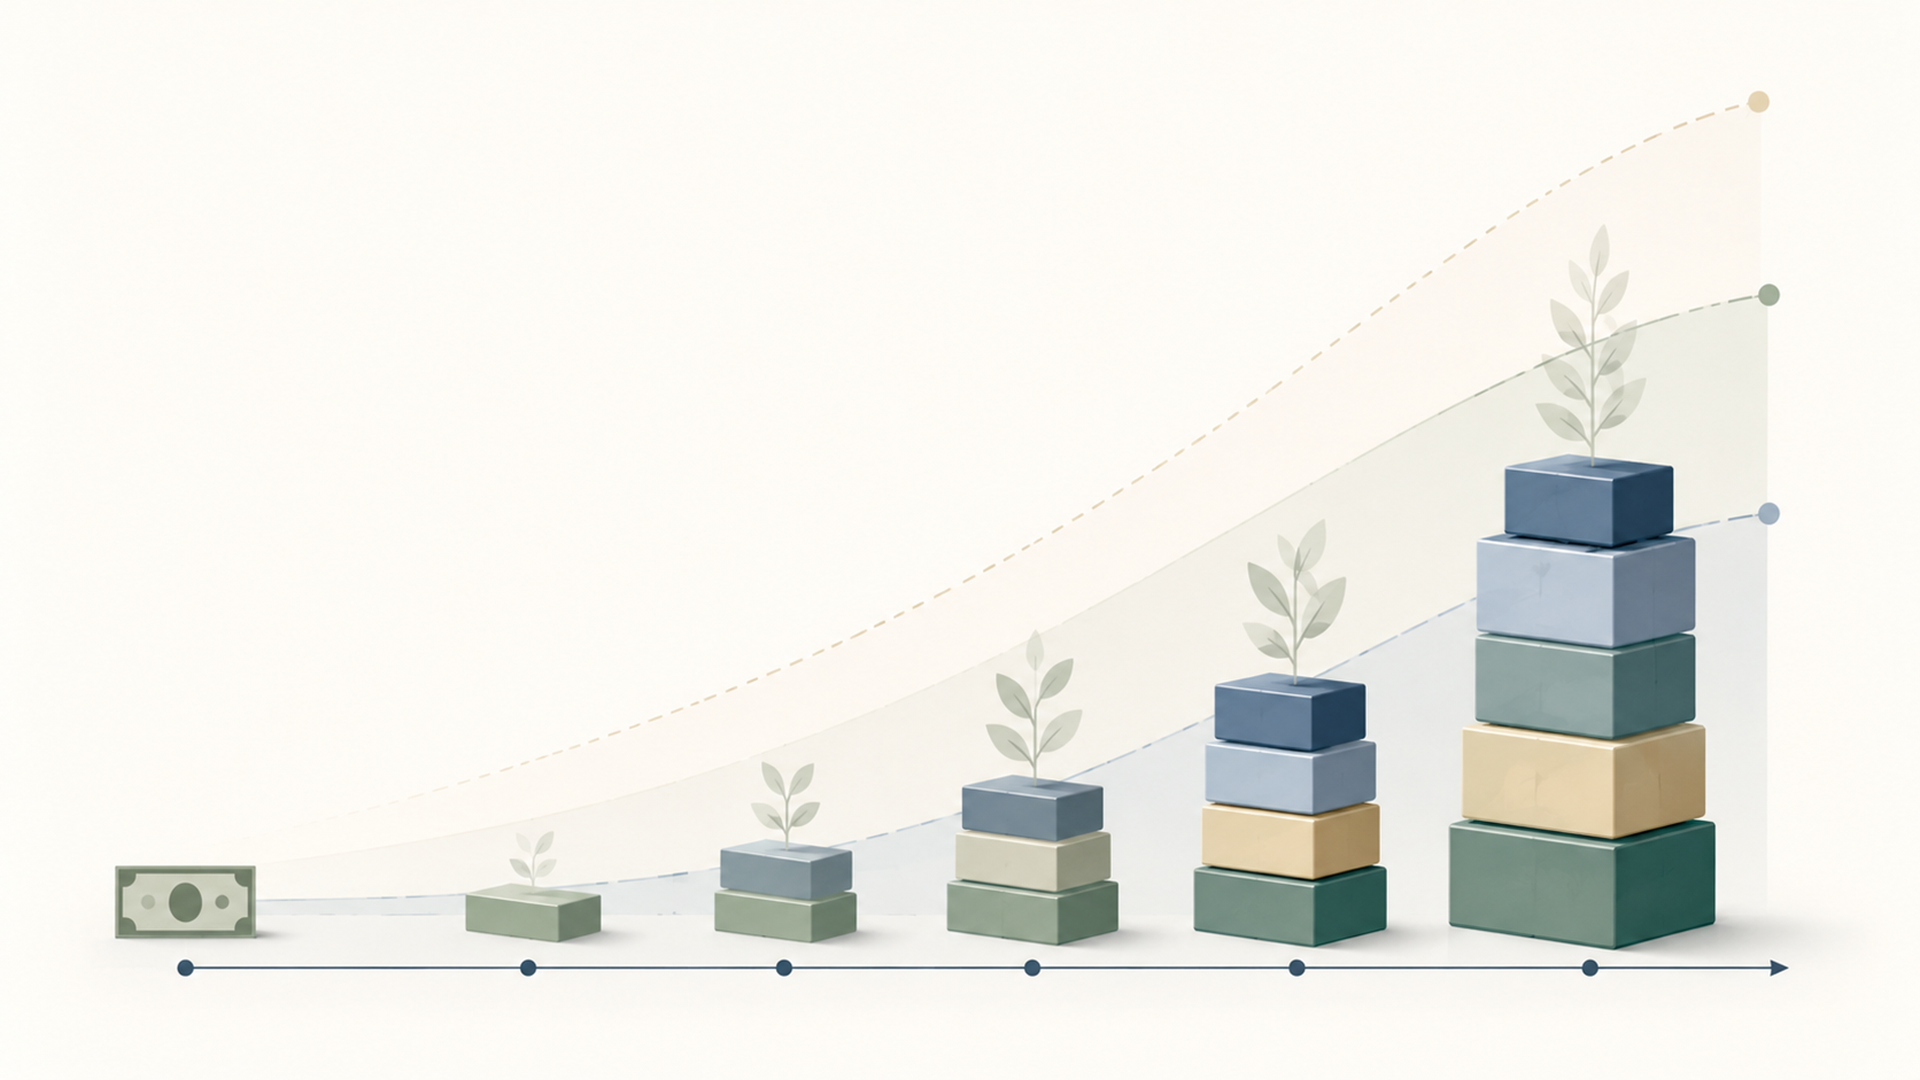
A one-time $100 invested for 20 years could become about $219 at 4%, $321 at 6%, $466 at 8%, or $673 at 10%, assuming returns compound annually with no fees, no taxes, and no withdrawals.
That range is more useful than one exact answer. The future value of $100 depends on the return earned, how long the money stays invested, investment costs, taxes, inflation, and whether dividends or interest are reinvested. Compound growth can do a lot over 20 years, but it does not remove market risk. Securities can lose value, and higher-return assumptions usually come with higher uncertainty.
This article is educational only. It is not personalized financial advice.
What $100 invested could be worth in 20 years
The table below uses a simple compound-growth formula:
Future value = $100 × (1 + annual return)^20
These are not forecasts. They are scenarios that show how sensitive the answer is to the return assumption.
| Annual return assumption | $100 after 20 years | Gain before fees and taxes | What the scenario means |
|---|---|---|---|
| 0% | $100 | $0 | No growth |
| 2% | $149 | $49 | Low-growth scenario |
| 4% | $219 | $119 | Modest-growth scenario |
| 6% | $321 | $221 | Middle-growth scenario |
| 8% | $466 | $366 | Higher-growth scenario |
| 10% | $673 | $573 | Strong-growth scenario |
| 12% | $965 | $865 | Very high-growth scenario |
Illustrative only. Bars are scaled from $0 to $1,000 and rounded to the nearest dollar. Assumes annual compounding, no fees, no taxes, no withdrawals, and a constant annual return.
The main lesson is not that 10% or 12% should be expected. The lesson is that small differences in annual return can create large differences over 20 years.
Why the answer is not a forecast
A calculator can make investment growth look smooth. Real markets are not smooth.
A $100 investment earning 8% every year for 20 years becomes about $466. But a real stock fund, bond fund, or diversified portfolio will not usually deliver the same return every year. Some years may be strongly positive. Some may be flat. Some may be negative.
Historical return datasets show exactly that unevenness. Aswath Damodaran’s long-running NYU Stern dataset tracks annual returns across stocks, Treasury bills, bonds, corporate bonds, real estate, and gold, including the compounded value of $100 invested in those assets over time. The point for beginners is simple: long-term returns are built from messy annual results, not a clean straight line.
That is why the better question is not “What will $100 definitely be worth?” It is “What could $100 become under a realistic range of assumptions?”
The three variables that matter most
1. Return
Return is the biggest visible driver. In the table above, the difference between 4% and 10% turns $100 into either $219 or $673. That is a large gap.
But return cannot be separated from risk. Higher expected returns usually require accepting more volatility, more uncertainty, or more chance of loss. All investments involve some degree of risk, and securities such as stocks, bonds, and mutual funds can lose money.
2. Time
Twenty years gives compounding room to work. The first few years may look underwhelming because the base is small. Later years matter more because growth is happening on the original $100 plus prior gains.
At 8%, the first year earns $8. By year 20, the same 8% return is applied to a much larger balance. That is the engine behind compounding.
3. Costs
Fees reduce the return that actually stays in the account. Fund fees and expenses are paid by investors and reduce fund investment returns. A higher-cost fund has to outperform a lower-cost fund just to leave the investor in the same place.
Here is how a simple 8% gross return changes once annual costs are included:
| Gross annual return | Annual cost assumption | Net annual return | $100 after 20 years |
|---|---|---|---|
| 8.0% | 0.00% | 8.00% | $466 |
| 8.0% | 0.25% | 7.75% | $445 |
| 8.0% | 0.50% | 7.50% | $425 |
| 8.0% | 1.00% | 7.00% | $387 |
| 8.0% | 2.00% | 6.00% | $321 |
The difference looks small at first. Over 20 years, it is not small.
What inflation does to the $100 number
Nominal growth is the number on the account statement. Real growth is what that money can buy.
If $100 grows to $466 over 20 years, that sounds strong. But if prices rise during those same 20 years, the spending power of that $466 is lower than the headline number suggests. The Consumer Price Index measures the average change over time in prices paid by urban consumers for a basket of goods and services, and FRED tracks CPI-based purchasing power data from the Bureau of Labor Statistics.
Using the 8% scenario from earlier:
| Nominal value after 20 years | Inflation assumption | Approximate value in today’s dollars |
|---|---|---|
| $466 | 2% per year | $314 |
| $466 | 3% per year | $258 |
| $466 | 4% per year | $213 |
Inflation does not mean investing is pointless. It means the real goal is not just making the number bigger. The real goal is preserving and growing purchasing power after costs, taxes, and inflation.
One-time $100 vs investing $100 every month
A one-time $100 investment is a useful example, but it is not how many people build wealth. Regular contributions usually matter more than obsessing over one perfect return assumption.
The table below compares a single $100 investment with investing $100 every month for 20 years. The monthly contribution example assumes $100 is added at the end of each month, returns compound monthly, and no fees or taxes are included.
| Annual return assumption | One-time $100 after 20 years | $100 monthly for 20 years |
|---|---|---|
| 4% | $219 | $36,677 |
| 6% | $321 | $46,204 |
| 8% | $466 | $58,902 |
| 10% | $673 | $75,937 |
This is the part that many beginner investing articles underplay. The first $100 matters because it starts the habit. The repeated $100 matters because it gives compounding more fuel.
For readers who want to test different assumptions, Jivaro’s InvestGrow calculator is a natural next step.
What kind of investment could produce these returns?
No investment can be assigned a guaranteed 20-year return. The return assumption depends on what the $100 is invested in.
A diversified stock-heavy portfolio might use a higher long-term scenario than a cash-heavy portfolio, but it also comes with larger drawdowns along the way. A more conservative mix may produce a smoother ride, but lower long-term growth. Asset allocation is the process of dividing a portfolio among categories such as stocks, bonds, and cash, while diversification spreads investments across and within those categories.
A simple way to think about it:
| Investment mix | Growth potential | Volatility | Practical reality |
|---|---|---|---|
| Cash-like holdings | Low | Low | Useful for short-term needs, but inflation can erode purchasing power. |
| Bond-heavy portfolio | Low to moderate | Low to moderate | Can reduce volatility, but still has interest-rate and credit risk. |
| Balanced portfolio | Moderate | Moderate | Spreads risk across multiple asset classes. |
| Stock-heavy portfolio | Higher | Higher | Better long-term growth potential, but larger declines are possible. |
The right framework is not “find the highest number.” It is “use a return range that matches the risk being modeled.”
Mistakes to avoid when estimating 20-year growth
Using one return number as if it is guaranteed
A 10% assumption can be useful for a scenario. It is not a promise. A better article, calculator, or spreadsheet should show a range of outcomes.
Ignoring fees
Fees may look harmless when the account is small, but they compound in reverse. The higher the ongoing cost, the harder the investment has to work to produce the same ending value.
Forgetting taxes
Taxes depend on country, account type, income, holding period, and the investment itself. In the U.S., investments held for personal or investment purposes are generally capital assets, and gains or losses are classified as short-term or long-term depending on how long the asset is held. Dividends and fund capital-gain distributions may also create taxable income in taxable accounts.
Comparing nominal numbers only
A future $466 is not the same as $466 today if prices rise for 20 years. Inflation-adjusted estimates are less exciting, but more honest.
Assuming $100 alone changes everything
The first $100 is valuable because it starts the process. But repeated contributions usually do more work than the first deposit. That does not make the first $100 unimportant. It makes it the beginning, not the whole plan.
FAQ
How much will $100 invested at 10% be worth in 20 years?
At a 10% annual return compounded once per year, $100 would become about $673 after 20 years before fees and taxes.
How much will $100 invested at 8% be worth in 20 years?
At an 8% annual return compounded once per year, $100 would become about $466 after 20 years before fees and taxes.
Is $100 enough to start investing?
It can be enough to learn how compounding works, but account minimums, fractional-share availability, fees, and investment choices vary by platform and country. The broader lesson is that starting amount matters less than time, costs, risk, and consistency.
Should the calculation include dividends?
For stock-market examples, total-return assumptions should include reinvested dividends. Price-only examples can understate long-term results. Damodaran’s S&P 500 return data explicitly includes dividends, which is one reason it is useful for long-term return context.
What is the safest assumption to use?
There is no single safest assumption. A cautious projection might show several cases, such as 4%, 6%, and 8%, then subtract fees and look at inflation-adjusted values. The point is not to predict perfectly. It is to avoid building expectations around one optimistic number.
Conclusion
A one-time $100 investment can grow meaningfully over 20 years, but the final number depends heavily on the return assumption. At 4%, it becomes about $219. At 8%, it becomes about $466. At 10%, it becomes about $673.
The more useful lesson is bigger than the $100. Compounding rewards time, reinvestment, low costs, and consistency. It also punishes unrealistic assumptions, high fees, ignored taxes, and inflation-blind planning. The best projection is not the biggest number on the page. It is the one that makes the assumptions clear enough to be useful.
References
- Investor.gov Compound Interest Calculator
- Investor.gov Beginners’ Guide to Asset Allocation, Diversification, and Rebalancing
- FINRA Asset Allocation and Diversification
- Aswath Damodaran, NYU Stern Historical Returns
- Bureau of Labor Statistics Consumer Price Index
- FRED Purchasing Power of the Consumer Dollar
- Investor.gov Mutual Fund and ETF Fees and Expenses
- IRS Topic No. 409: Capital Gains and Losses
- IRS Topic No. 404: Dividends and Other Corporate Distributions